In the first half of 2024, the global mobile gaming market experienced a modest recovery, with a year-on-year revenue growth of 4.7%. Faced with a challenging global environment and increasing competition, mobile game companies worldwide have adopted more strategic approaches. They are prioritizing high-quality products and long-term operations while exploring new growth opportunities in low-cost, quick-return segments.
To support global mobile game companies, SocialPeta has partnered with Tenjin to produce the report, Insights into Global Mobile Game Marketing & Ad Spend Trends for H1 2024. This report offers a comprehensive analysis of the global mobile gaming market’s performance in the first half of 2024, featuring insights from industry experts at AdQuantum, App Masters, Gamelight, AppSamurai, AppTweak, Gamee Studio, GameGeek, Niko Partners, Gamesforum, Appvertiser, Geeklab, UGC Ninja, and Mobidictum.
Key takeaways:
- Global market trends: Despite a decline in downloads, overall revenue has grown, signaling a market recovery.
- Popular game genres and regions: Different genres are excelling in various regions, with strategy and hyper-casual games leading the way.
- Ad spend distribution: iOS accounted for 40% of ad spend, while Android held a 60% share in H1 2024.
- Mini-games and AIGC: Mini-games are becoming a popular segment for Chinese developers, with AIGC widely used in RPGs and strategy games.
Steady increase in global mobile game revenue
The global mobile game market’s recovery has become increasingly apparent based on its performance in the first half of 2024. By year-end, it’s expected that the decline in global mobile game downloads will slow compared to the first half, while revenue continues to grow steadily.
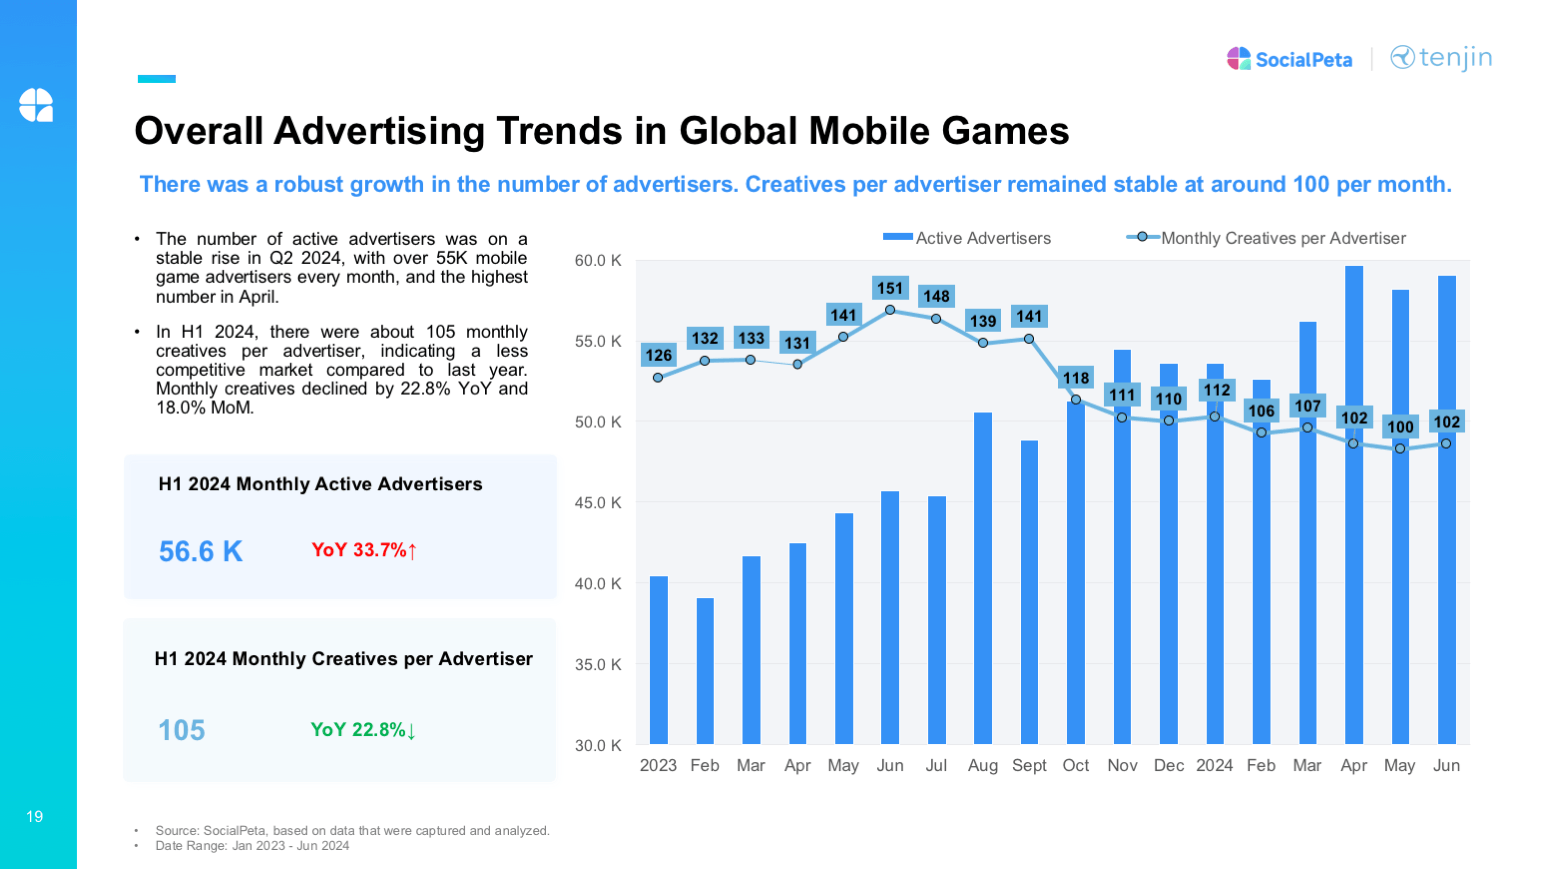
The number of advertisers has grown robustly, with the average number of creatives holding steady at around 100 per month. In Q2 2024, the number of unique mobile game advertisers exceeded 55,000 each month, with April showing the highest count, indicating a consistent upward trend.
Despite the rising number of advertisers, the average monthly number of creatives per advertiser remained around 105 in the first half of 2024. Compared to last year, marketing competition has eased somewhat, with the average monthly number of creatives decreasing by 22.8% year-on-year and 18.0% month-on-month.
Overall advertising trends in global mobile games
Source: SocialPeta
In H1 2024, the Hong Kong, Macau, and Taiwan regions led in advertising competitiveness, topping the charts in both the number of advertisers and creative volume. Western Europe had the highest average number of mobile game advertisers, with over 31,000 per month.
The U.S., Latin America, and Southeast Asia also saw over 20,000 advertisers monthly. Creative volume averaged over 100 in the Hong Kong, Macau, and Taiwan regions, as well as in Oceania and the U.S., while Southeast Asia experienced a slight easing in competition, averaging 92 creatives per month.
Insights into global mobile game advertising in top regions

Source: SocialPeta
Western Europe accounts for 13% of global mobile game revenue
In the first half of 2024, the mobile gaming market in Western Europe performed exceptionally well, with revenue increasing by approximately 10% year-on-year. The top three revenue-generating genres were Slots, 4X (strategy games), and Match-3+ games. The region’s download volume reached around 2 billion, accounting for 7% of the global total. The top three subgenres by downloads were hyper-casual puzzle, hyper-casual simulation, and hyper-casual work games.
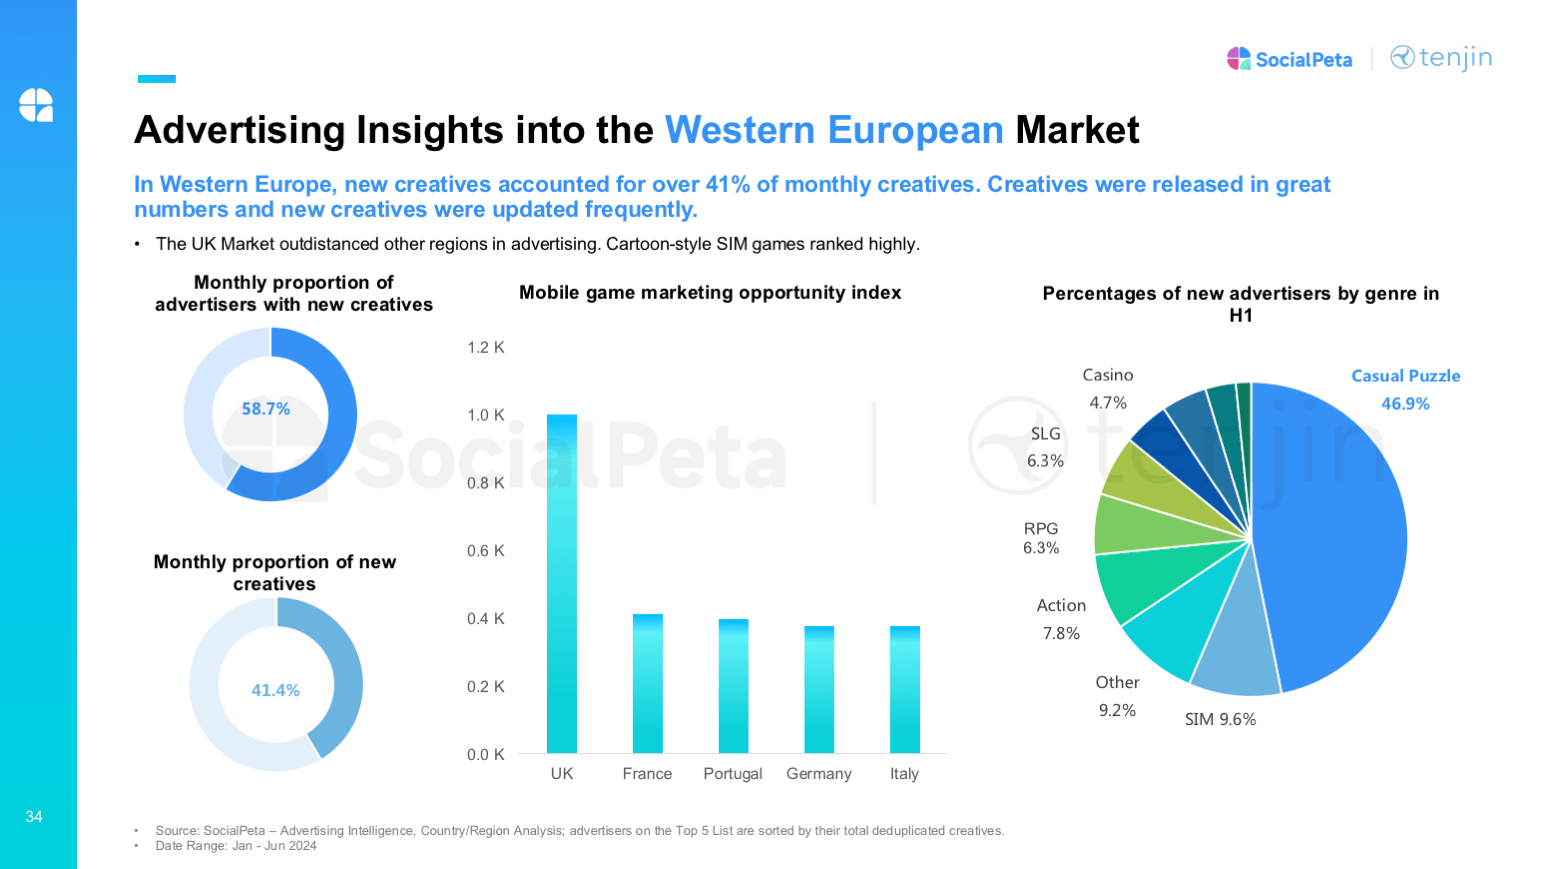
In this region, 58.7% of advertisers launched new creative assets on a monthly basis, showing significant investment in ad creatives and faster iteration of creative types. The UK market outperformed other regions, with simulation games featuring cartoon-style graphics ranking high. The monthly share of new ad creatives was 41.0%. Among the newly launched ads, casual puzzle games had the highest share at about 47%, followed by simulation games at around 10%.

Ultimate App Growth Guide 2025
Boost your app’s success with the Ultimate App Growth Guide! 🚀 Expert insights, proven strategies & must-know tips. Download now!
Master app growthAdvertising insights into the Western European market
Source: SocialPeta
In addition to Western Europe, this report also provides a detailed analysis of the markets in the United States, Japan, South Korea, Hong Kong, Macau and Taiwan regions, Southeast Asia, Latin America, and the Middle East.
The US leads in ad spend for H1 2024 across iOS and Android
The US remains the top country by ad spend for H1 2024 on both iOS and Android. When comparing the ad spend on both platforms, Android accounts for 60%, while iOS takes the remaining 40%.
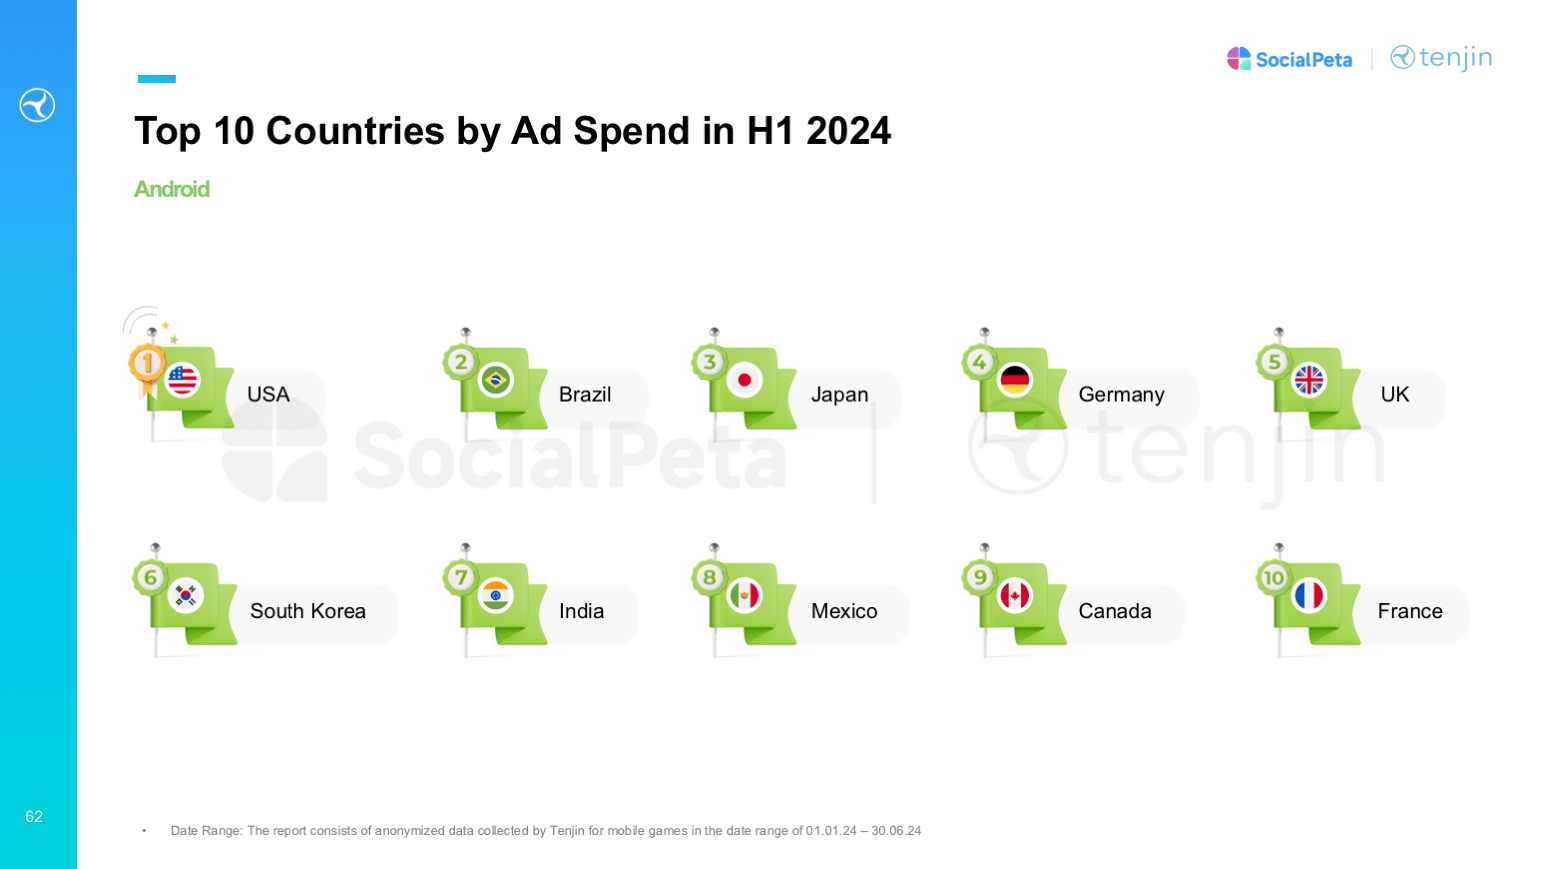
In terms of top countries by ad spend, the US holds the leading position on both platforms. Brazil ranks second on Android but falls to the top 10 on iOS, while Japan ranks second on iOS and third on Android. The top 10 chart for both platforms also includes the UK, Germany, and Canada.
Top 10 countries by ad spend in H1 2024
Source: SocialPeta
As for ad networks, Google Ads, AppLovin, and Mintegral are all featured in the rankings, though their positions vary. On iOS, AppLovin ranks first and Google Ads second, while on Android, the order is reversed.
Additionally, this whitepaper delves into the marketing performance of notable titles such as Last War: Survival, Legend of Mushroom, Solo Leveling: Arise, and Royal Match. These case studies offer a comprehensive look at the strategies that propelled these games to success across various markets.
Spanning 70 pages, the report provides an in-depth analysis of five popular game genres and key insights into the most influential overseas markets, including the U.S., Japan, South Korea, Southeast Asia, and more. It offers actionable intelligence to help companies navigate the complexities of the global mobile game market and refine their marketing strategies for better outcomes.
Download your copy today and stay ahead in the ever-evolving mobile gaming landscape.