In our TikTok App Report, we provide the most extensive research available, presenting breakdowns of the app’s financials and its parent company’s financial performance. The report also includes usage breakdowns by region and country, download metrics, demographics, and social app benchmarking data.
How does TikTok make money?
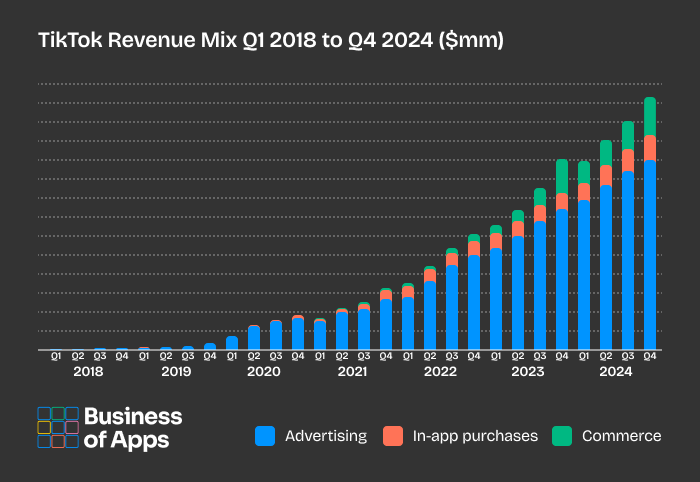
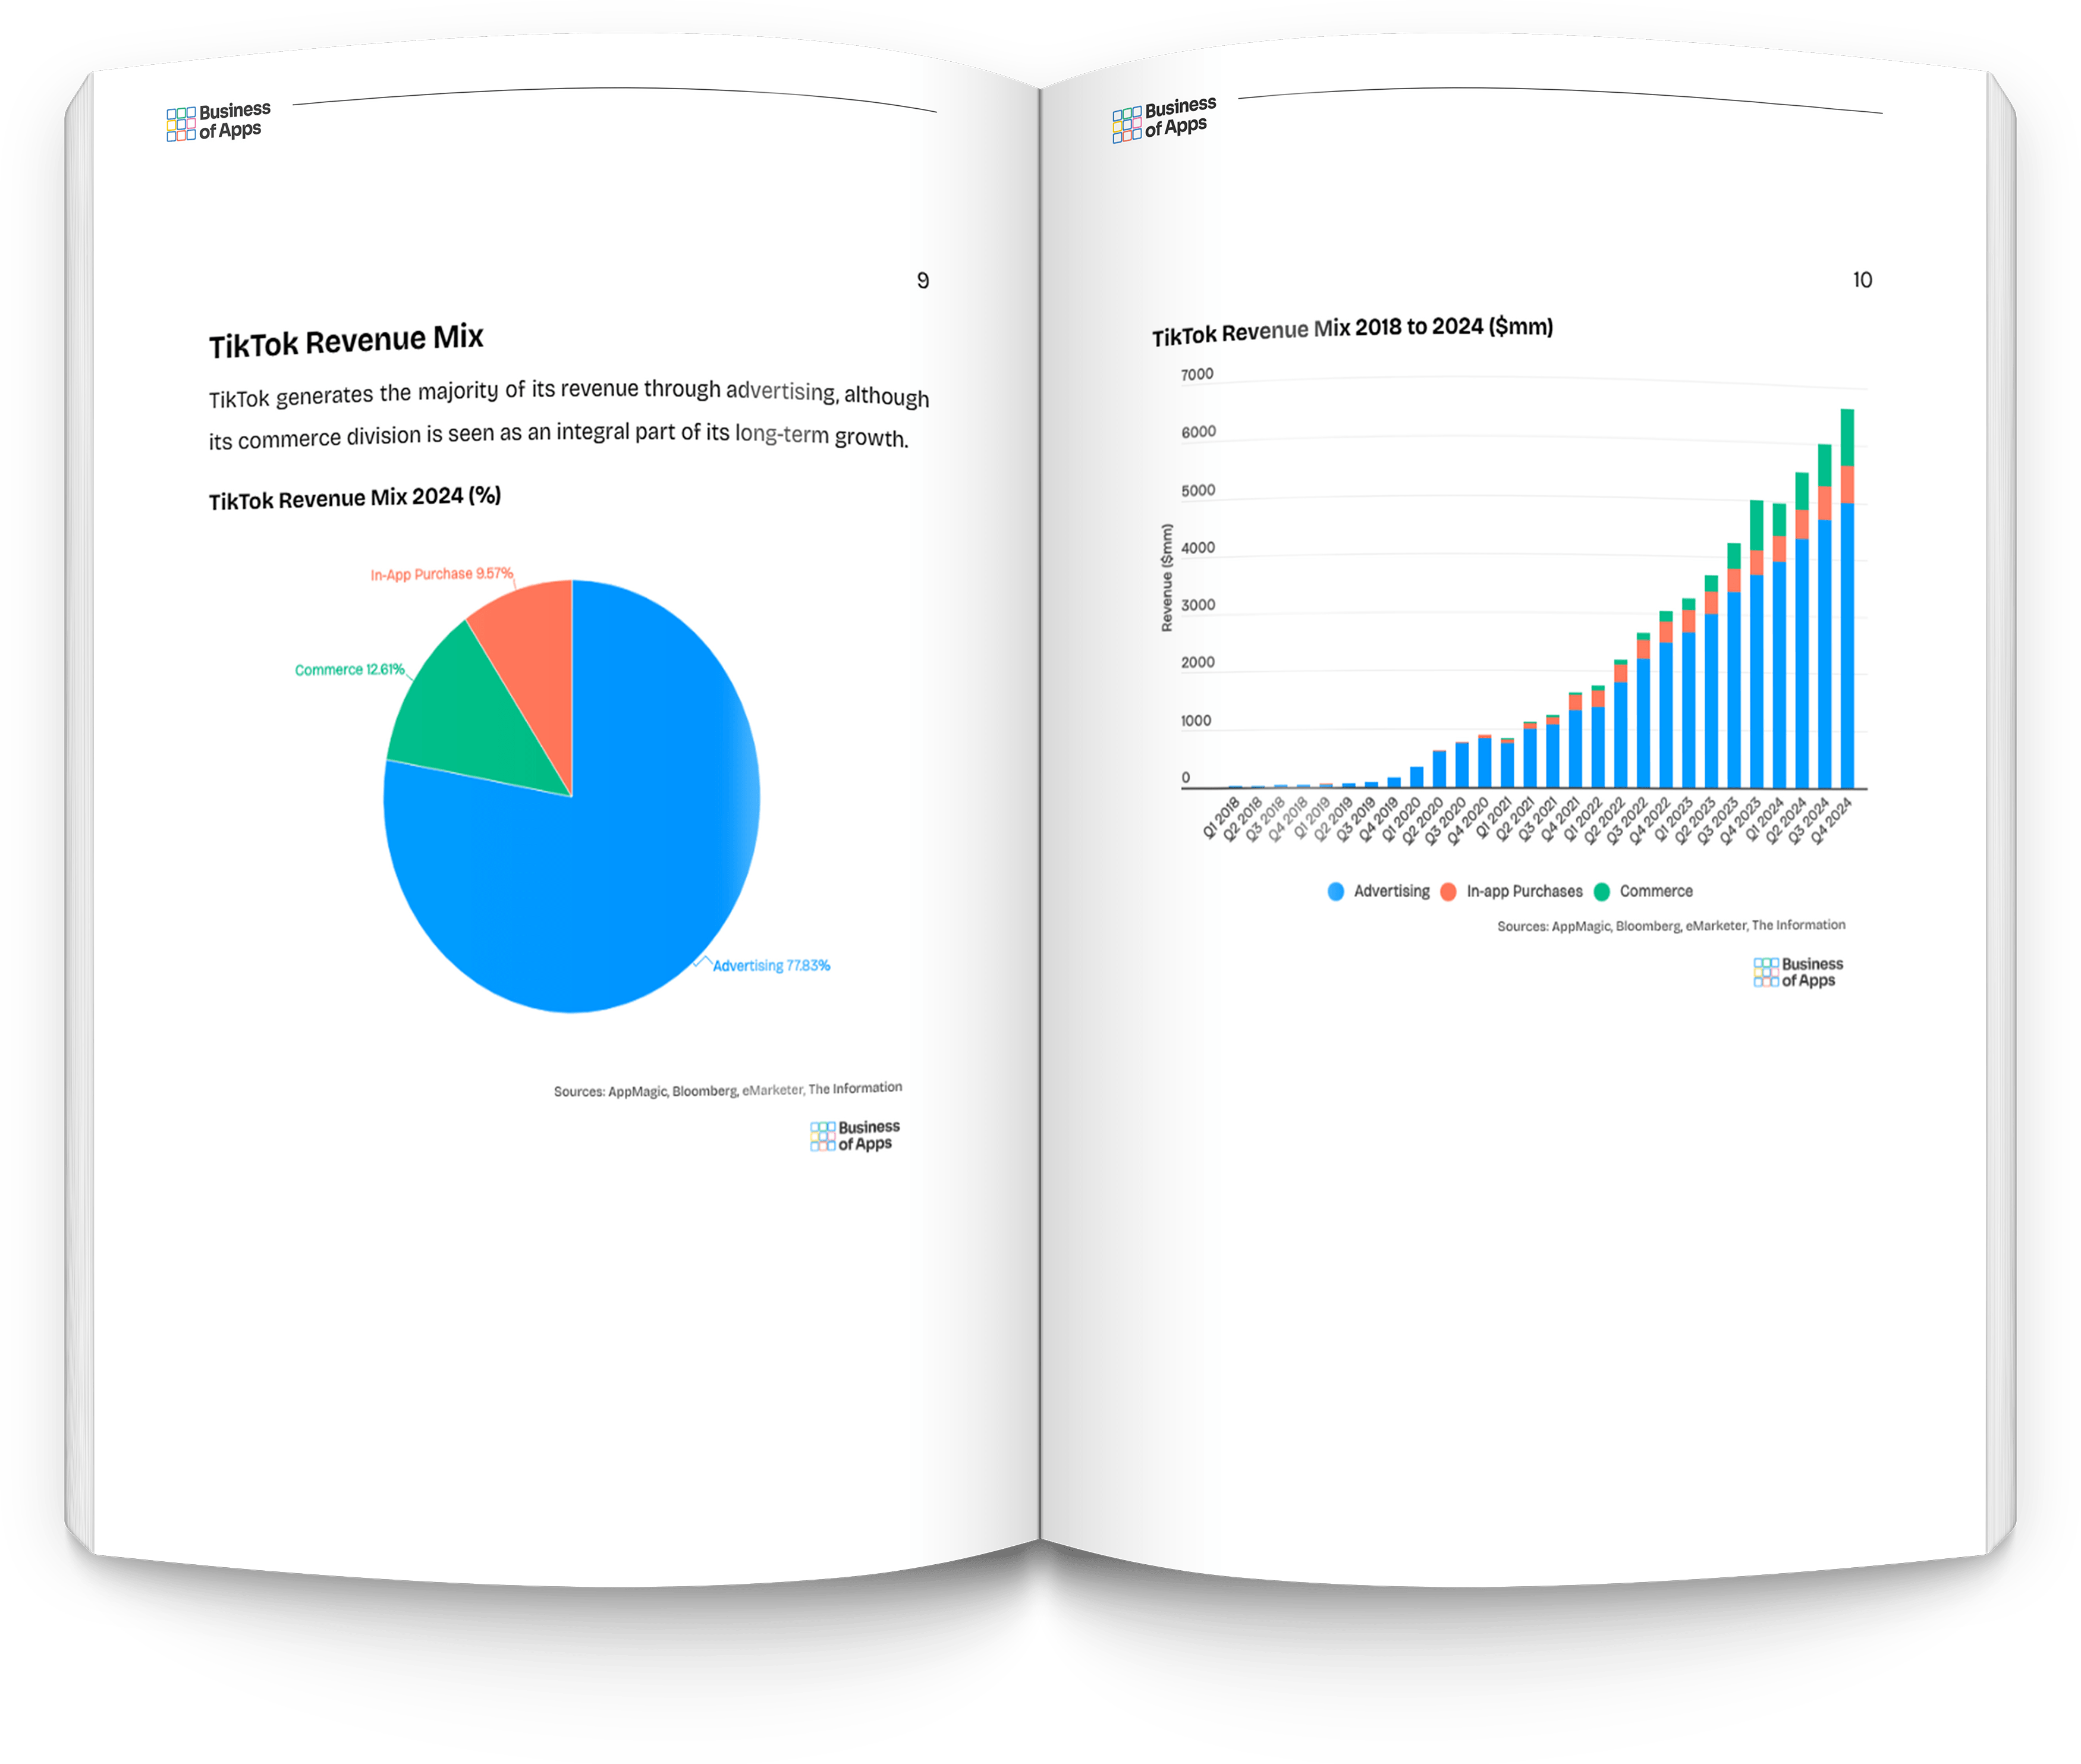
TikTok made $23 billion revenue in 2024, with approximately 80% of that coming from advertising. Commerce from TikTok Shop and consumable gifts were responsible for the rest of the revenue.
How much of ByteDance revenue comes from TikTok?
ByteDance made $146 billion revenue in 2024, with about 65% coming from Douyin, the Chinese version of TikTok. TikTok accounted for about 15%.
How many users does TikTok have?
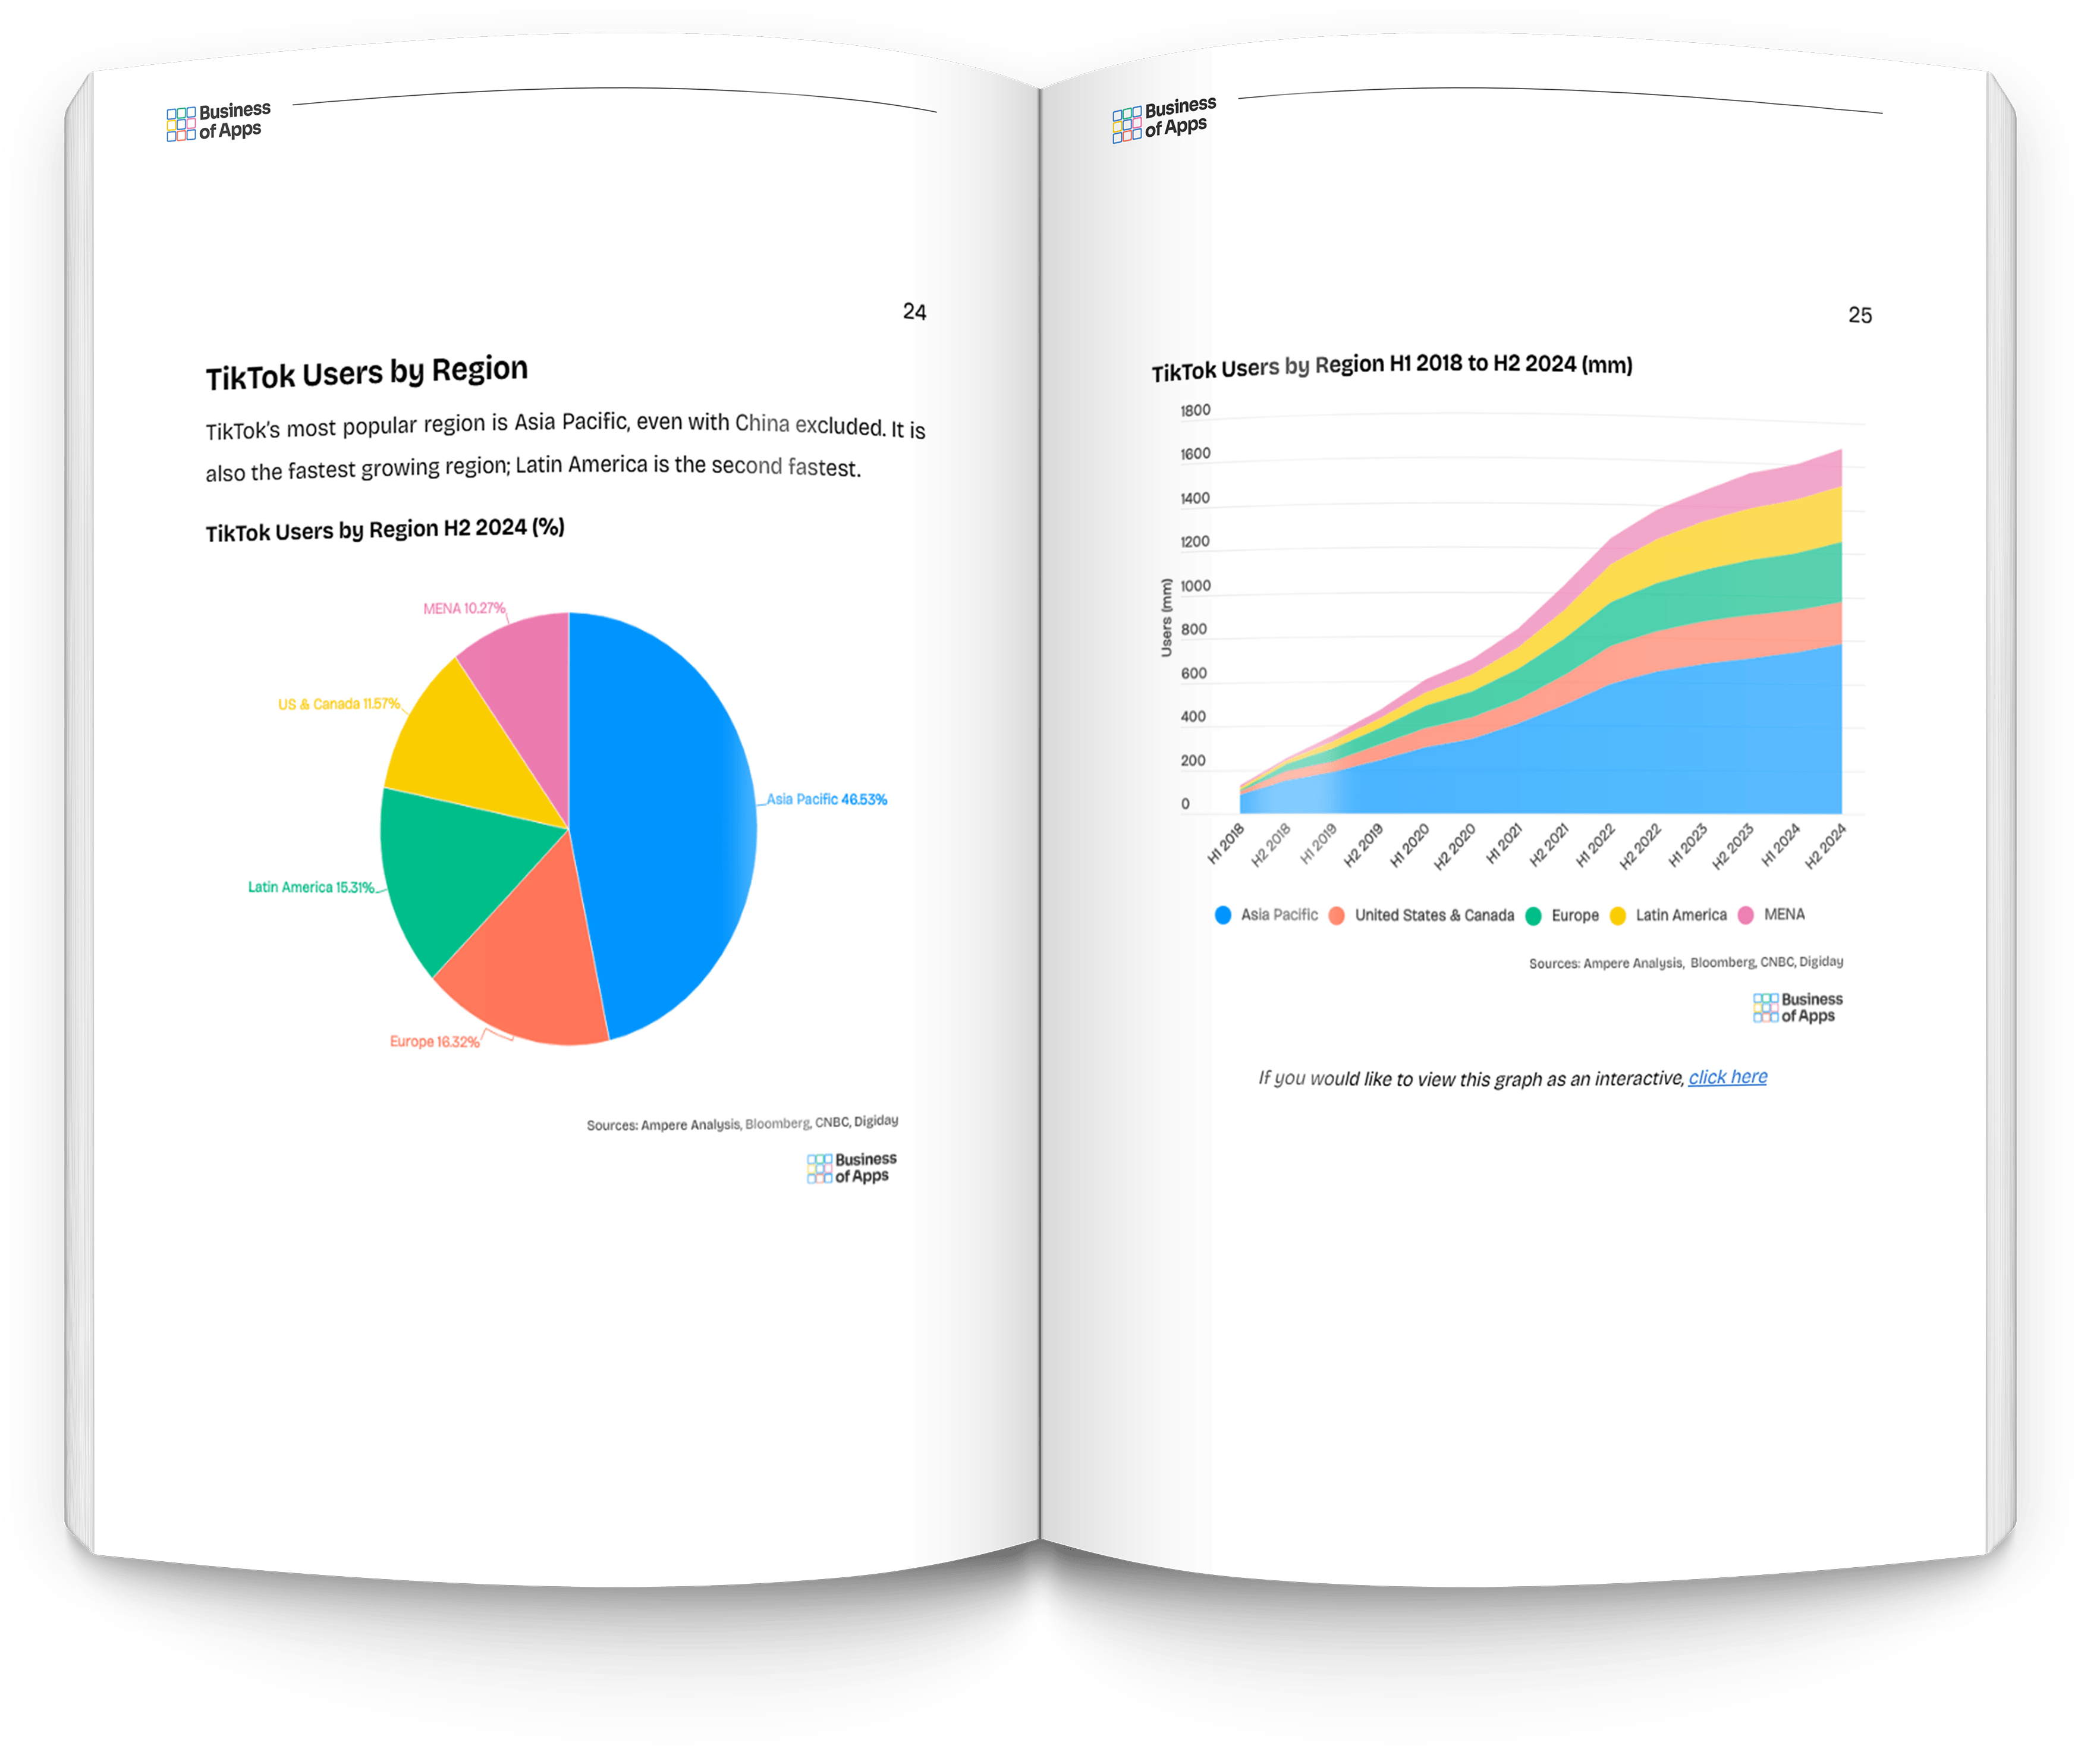
TikTok reached 1.6 billion active users in 2024, adding about 100 million users in that year. It is the fifth largest social app by users.
Sector overview
TikTok was the first major platform to break through the Facebook-Instagram stranglehold since Snapchat when it launched in 2018. With its algorithmic feed of short-form videos, it introduced an entirely new and even more addictive form of social media to the world.
TikTok has ballooned into a huge network, with over 1.5 billion users around the globe and another 700 million if you include the Chinese version of TikTok, Douyin. This success has forced Facebook, Snapchat and YouTube to respond with their own short-form apps, mimicking TikTok.
As TikTok grew in popularity, so have ByteDance’s ambitions for the app. While a majority of the revenue from TikTok comes from ads, it is trying to build out its ecommerce and in-app purchase services. In China, ecommerce and in-app purchases account for a much higher percentage of its total revenue.
TikTok has faced significant pressure from the US government over the past five years. It has been accused of passing data on about US public officials to the Chinese government, and both the Biden and Trump administrations have tried to ban or decouple TikTok from ByteDance.
Table of contents
- TikTok Revenues
- Revenue
- Revenues by Type
- GMV
- ByteDance Revenue
- Valuation
- TikTok Users
- Total Users
- Users by Region
- Users by Country
- Douyin Users
- TikTok Downloads
- Annual and Quarterly Downloads
- Cumulative Downloads
- Downloads by Country
- TikTok Demographics
- Age Demographics
- Age Demographics by Country
- Gender Demographics
- TikTok Benchmarks
- Social App Benchmarks
- Engagement Metrics
- Advertising Metrics
- Most Followed Accounts
The TikTok Report – Research, Insights and Statistics is provided as downloadable PDF document with all data presented as charts and tables. It provides an overview of the company’s financials, as well as data on demographics and user breakdowns.
What’s included?
- Document: PDF
- Charts: 78
- Data Points: 1485
- Pages: 84
Don’t waste time searching the internet for TikTok statistics – get all the main analysis in this report in one package, sourced and analysed from multiple validated sources.
List of Charts
- TikTok Revenues
- TikTok Revenue Mix
- TikTok Advertising Revenue
- TikTok Commerce Revenue
- TikTok Shop GMV
- TikTok In-App Purchase Revenue
- Bytedance Revenue
- ByteDance Revenue with TikTok
- ByteDance Revenue Breakdown
- ByteDance Valuation
- TikTok Users
- TikTok Users by Region
- TikTok Users by Country
- TikTok Users in the United States
- TikTok Users in the United Kingdom
- TikTok Users in Germany
- TikTok Users in France
- TikTok Users in Spain
- TikTok Users in Italy
- TikTok Users in Indonesia
- TikTok Users in Brazil
- TikTok Users in Mexico
- TikTok Users in Pakistan
- TikTok Users in Japan
- Douyin Users
- TikTok Total Usage in United States
- TikTok Quarterly Downloads
- TikTok Annual Downloads
- TikTok Cumulative Downloads
- TikTok Top Countries by Downloads
- TikTok Now Downloads
- TikTok Age Demographics
- TikTok Age Demographics in the United States
- TikTok Age Demographics in the United Kingdom
- TikTok Age Demographics in China
- TikTok Users Under 18 by Country
- TikTok Gender Demographics
- TikTok Gender Demographics by Country
- Social App Revenues
- Social App Users
- Social App Conversion Rates
- Social App Retention Rates
- Social App Performance Rates
- Social App ATT Opt-In Rates
- Average Time Spent on Social Apps
- Engagement Rate by Following
- Influencer Engagement by Account Size
- Engagement with Influencers by Platform
- Influencers Leading to Purchase by Platform
- Marketers Preferred Platforms
- Content Sharing Type by Platform
- Engagement by Activity Type
- Monthly Time Spent on App
- Click-Through Rate by Social App
- CPM Rate by Social App
- TikTok Sponsored Ad CTR Rate
- Videos Published Weekly by Category
- Videos Published Weekly by Account Size
- Most Followed TikTok Accounts
- Most Listened to Sounds on TikTok
How does it work?
To get access to the TikTok Report – Research, Insights and Statistics hit the buy now button above. After payment you will be taken to the download page to access your TikTok Report – Research, Insights and Statistics PDF. If you need any help email data@businessofapps.com.
We have joined Treeapp, an incredible organization dedicated to reforesting the world. They will plant one tree for your data report purchase.
What our customers say about our reports
“Your report gave us some very useful insights on app statistics. As we are starting to develop apps it’s crucial information”
“This report is great work, it helped us get a better understanding of revenue and growth to include it in our analysis for LatAm. It has been very useful.”
“We have found Business of Apps data to be most accurate and complete on the web.”
“All the metrics and KPIs I was looking for are in one document for a very good price. The report was exactly what I expected.”
"There was an abundance of excellent information in the report, well worth the money. There were areas which had information I haven't seen anywhere else."
"Money well spent as far as I am concerned. A clear, well-written report"
“What a great resource!”
"This data has been a huge help for us launching our dating app"

