The Social App Report provides hundreds of pages of statistics on the industry, covering all of the major social apps. In the report, we look at the financials of these apps, usage and install figures, and demographics. This report also includes benchmarking data of the social app industry.
Which social company generated the most revenue?
Meta Platforms, by a lot. In 2024, the company made $164.5 billion revenue from its social platforms, with Facebook contributing $93 billion and Instagram $66 billion. YouTube is the only app in the same vicinity with $36.1 billion revenue.

What is the market size of the social app industry?
The social app industry has a market size of approximately $330 billion. This has been primarily driven by Meta Platforms apps: Facebook and Instagram.
How many social media accounts are there worldwide?
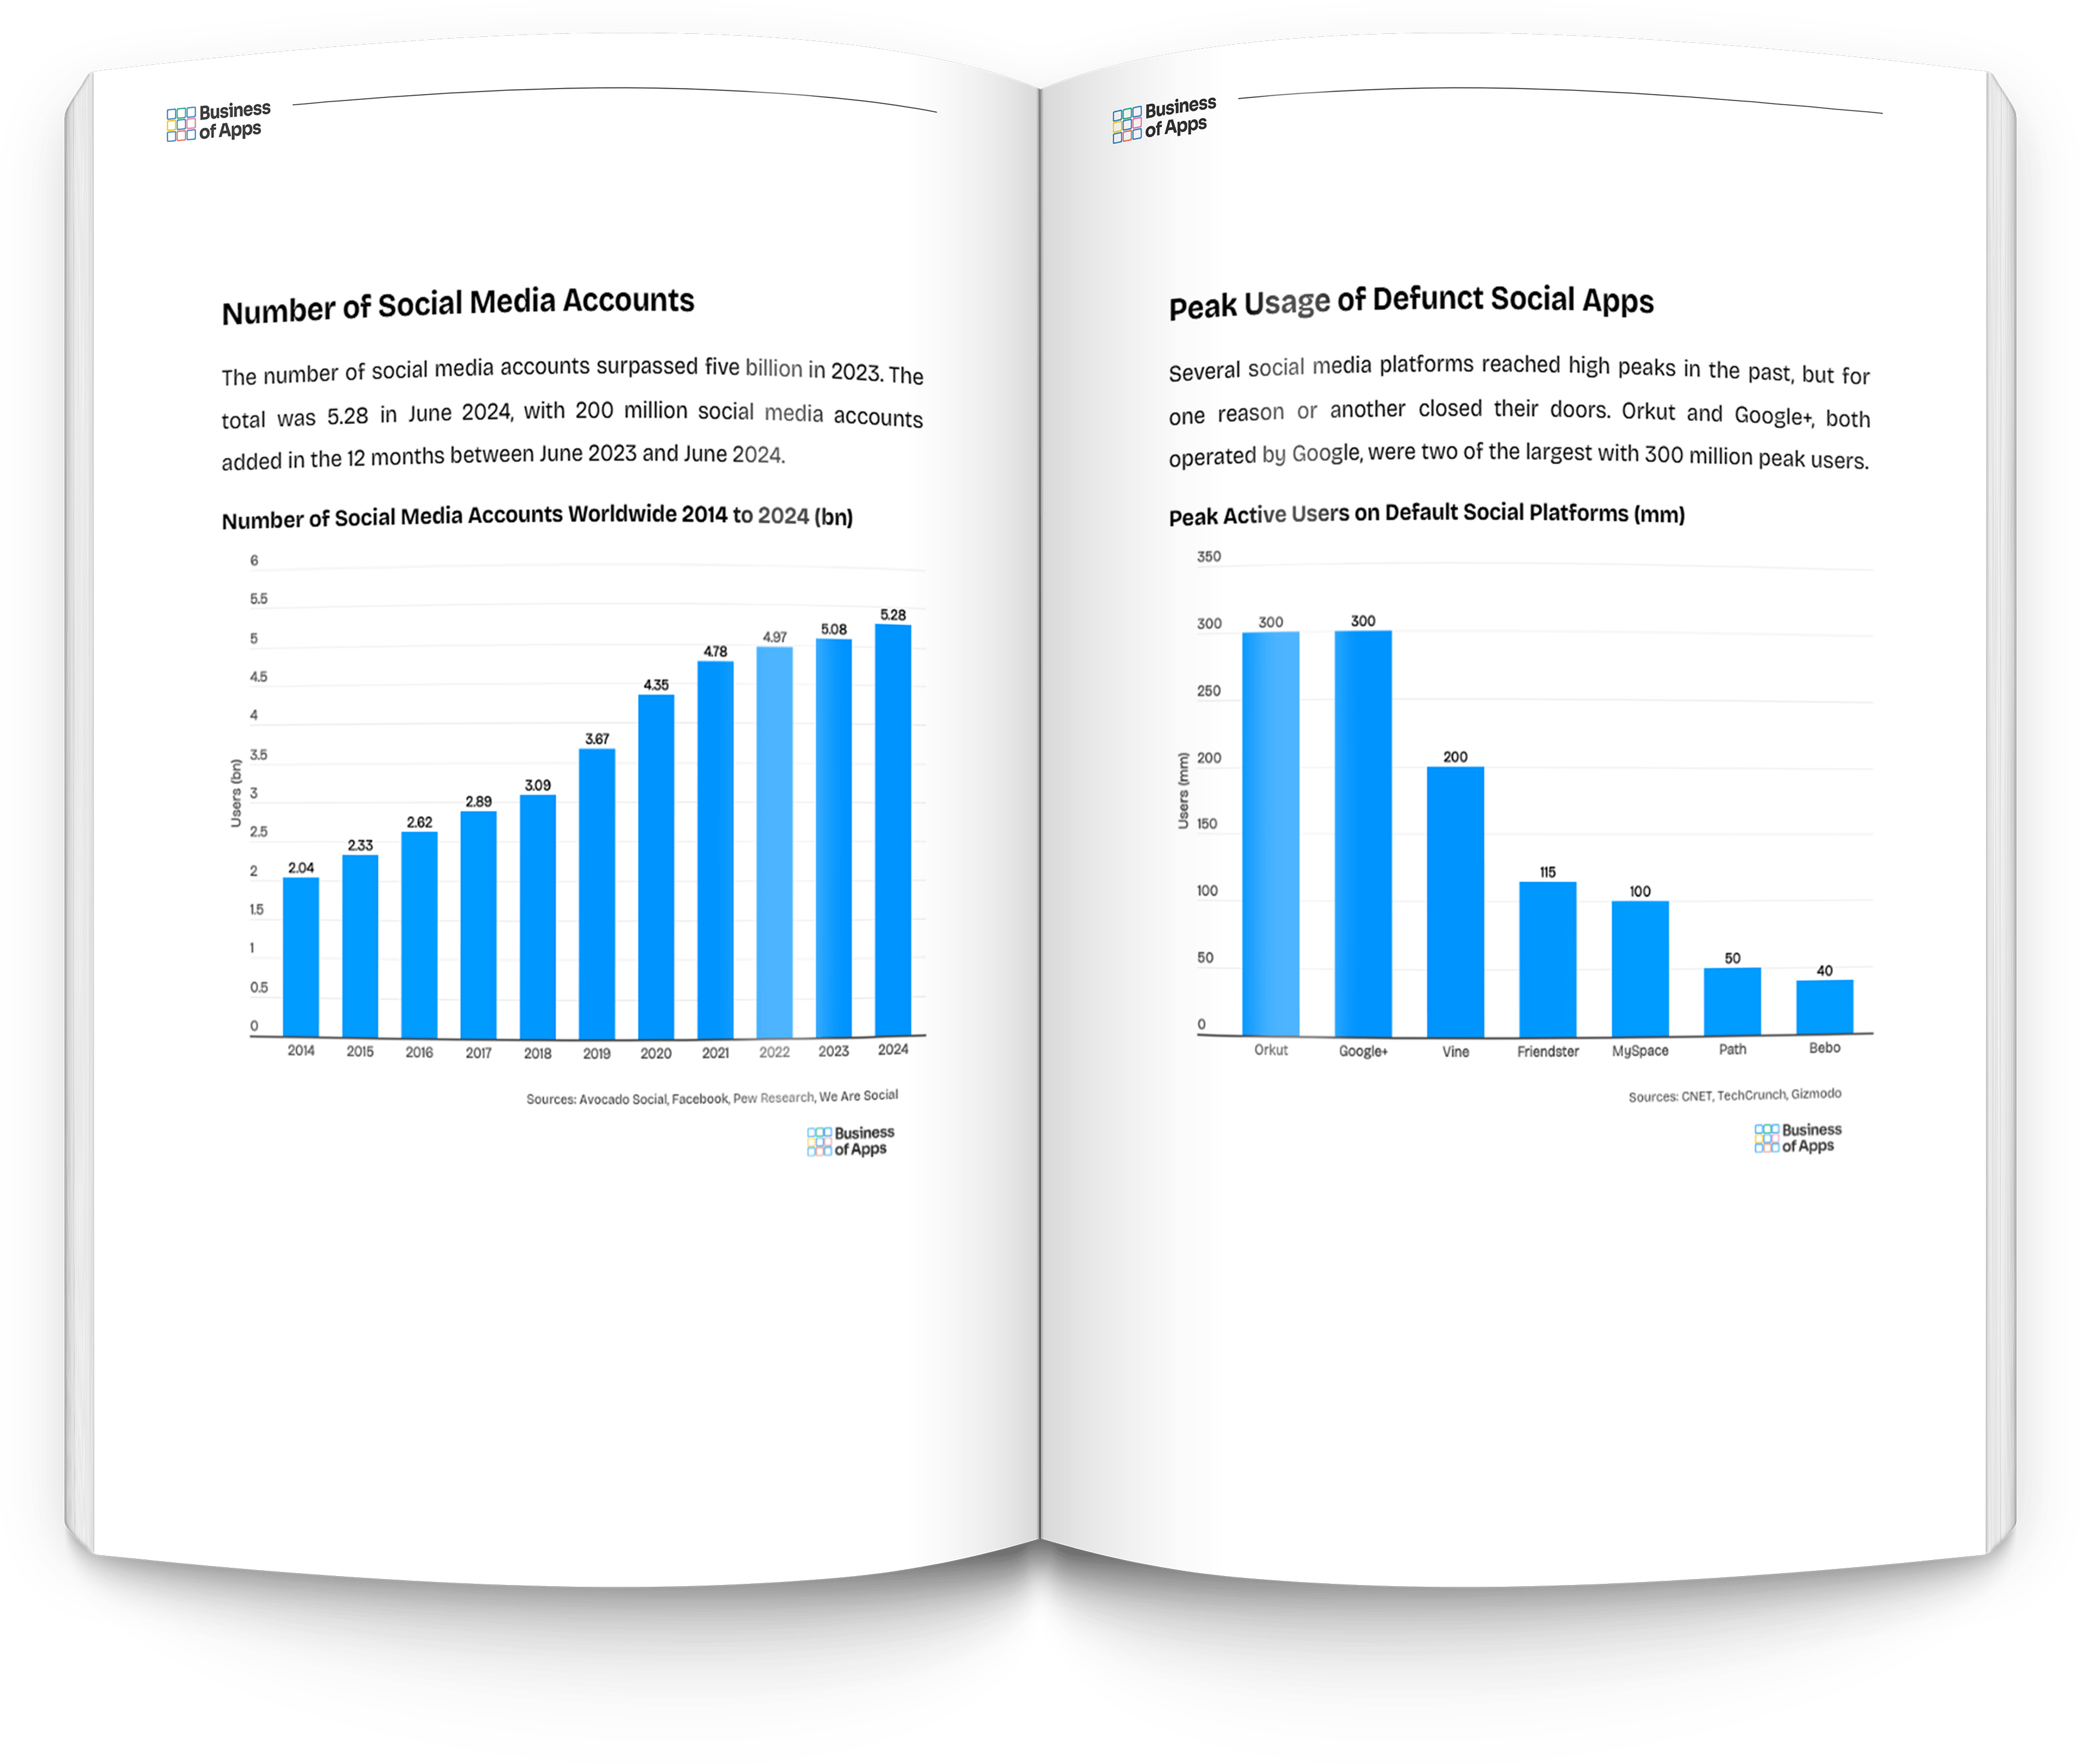
The number of social media accounts surpassed five billion in 2023, and 200 million accounts were added in 2024. About 57% of all social media users are on Facebook.
Sector overview
The social app market in the 2010s was dominated by one company: Facebook. Meta Platforms, as it’s now known, has the most users with Facebook and the fastest growing social and messaging platforms, in Instagram and WhatsApp.
Only YouTube can compete with Facebook in terms of users, but on revenue it is still in far behind the social media giant. Other competitors, such as Snapchat, Twitter and Pinterest, have a much smaller audience and generate less revenue from each user.
The 2020s are a continuation of Meta Platforms’ dominance, but TikTok has put a spanner in the works with its algorithmic ‘for you’ page. Facebook launched Reels as a counter to TikTok, which has become the most competitive short-form video service to TikTok.
But, outside of TikTok, it is unlikely that Facebook will be challenged in the next few years by any new social media company. AI, in the form of generative chatbots, may offer some form of competition for time spent, but Facebook has integrated its own AI chatbot into Messenger and Instagram.
Table of contents
- Social App Financials
- Market Size
- Market Size Forecast
- Individual App Revenues
- Average Revenue per User
- Individual App Net Income
- Social App Usage
- Total Users
- Individual App Users
- Number of Accounts
- Defunct App Peak Users
- Social App Downloads
- Total Downloads
- Individual App Downloads
- Social App Demographics
- Individual App Users by Country
- Individual App Users by Age
- Individual App Users by Gender
- Social App Benchmarks
- Retention, Conversion Rates
- Average Time Spent
- Engagement Metrics
- Advertising Metrics
- Top Followed Accounts
The Social App Report – Research, Insights and Statistics is provided as downloadable PDF document with all data presented as charts and tables. So you can easily extract graphics and individual data. It provides an overview of the company’s financials, as well as data on demographics and user breakdowns.
What’s included?
- Document: PDF
- Charts: 146
- Data Points: 2508
- Pages: 154
Don’t waste time searching the internet for app data – get all the main analysis in this report in one package, sourced and analyzed from multiple validated sources.
What apps are covered in this report?
- TikTok
- YouTube
- Snapchat
- X (Twitter)
- Messenger
- BeReal
- Threads
- Telegram
- Bluesky
List of Charts
- Social App Market Size
- Social App Market Size Forecast
- Social App Revenues
- Quarterly and Annual Revenues
- Facebook Revenue
- Facebook Revenue by Region
- Instagram Revenue
- Instagram and Facebook Revenue
- WhatsApp Revenue
- YouTube Revenue
- YouTube Revenue by Type
- LinkedIn Revenue
- Twitter Revenue
- Snapchat Revenue
- Snapchat Revenue by Region
- TikTok Revenue
- TikTok Revenue by Type
- Pinterest Revenue
- Pinterest Revenue by Region
- Reddit Revenue
- Average Revenue Per User
- Annual ARPU Growth
- Facebook Profit
- Snapchat Profit
- Pinterest Profit
- Social App Usage
- Social App Users
- Facebook Users
- Facebook Users by Region
- Instagram Users
- Instagram Users by Region
- WhatsApp Users
- YouTube Users
- TikTok Users
- TikTok Users by Region
- TikTok Users by Country
- LinkedIn Users
- Twitter Users
- Microblogging App Users
- Snapchat Users
- Snapchat Users by Region
- Pinterest Users
- Pinterest Users by Region
- BeReal Users
- Reddit Users
- Number of Social Media Accounts
- Peak Defunct Social Media Users
- Social App Downloads
- Facebook Downloads
- Facebook Messenger Downloads
- Instagram Downloads
- WhatsApp Downloads
- TikTok Downloads
- YouTube Downloads
- LinkedIn Downloads
- X Downloads
- Threads Downloads
- Bluesky Downloads
- Snapchat Downloads
- Pinterest Downloads
- Reddit Downloads
- BeReal Downloads
- Social App Demographics
- App Users by Country
- Facebook Users by Country
- Instagram Users by Country
- WhatsApp Users by Country
- YouTube Users by Country
- TikTok Users by Country
- LinkedIn Users by Country
- X Users by Country
- Snapchat Users by Country
- Pinterest Users by Country
- Reddit Users by Country
- Apple App Store Social App Users by Age
- Google Play Store Social App Users by Age
- Facebook Users by Age
- Instagram Users by Age
- YouTube Users by Age
- TikTok Users by Age
- LinkedIn Users by Age
- X Users by Age
- Snapchat Users by Age
- Pinterest Users by Age
- BeReal Users by Age
- Reddit Users by Age
- App Users by Gender
- Facebook Users by Gender
- Instagram Users by Gender
- WhatsApp Users by Gender
- YouTube Users by Gender
- TikTok Users by Gender
- LinkedIn Users by Gender
- X Users by Gender
- Snapchat Users by Gender
- Pinterest Users by Gender
- BeReal Users by Gender
- Reddit Users by Gender
- Social App Conversion Rates
- Social App Retention Rates
- Social App Crash-Free Sessions
- Social App Low-Memory Warnings
- Social App ATT Opt-In Rates
- Average Time Spent
- Average Time Spent by Region
- Average Time Spent by Country
- Daily Engagement Rate on Social Apps
- Number of Monthly Sessions on Social Apps
- Session Duration on Social Apps
- Engagement Rate by Following
- Engagement Rate with Influencers by Platform
- Micro-Influencer Engagement by Platform
- Influencer Lead to Purchase by Platform
- Marketers Planning to Use Platform
- Reasons For Using Social Media
- Social Media User Overlap
- Click Through Rate
- Cost Per Click
- Top Creators
How does it work?
To get access to the Social App Report – Research, Insights and Statistics hit the buy now button above. After payment you will be taken to the download page to access your Social App Report – Research, Insights and Statistics. If you need any help email david.curry@businessofapps.com.
We have joined Treeapp, an incredible organization dedicated to reforesting the world. They will plant one tree for your data report purchase.
What our customers say about our reports
“Your report gave us some very useful insights on app statistics. As we are starting to develop apps it’s crucial information”
“This report is great work, it helped us get a better understanding of revenue and growth to include it in our analysis for LatAm. It has been very useful.”
“We have found Business of Apps data to be most accurate and complete on the web.”
“All the metrics and KPIs I was looking for are in one document for a very good price. The report was exactly what I expected.”
"There was an abundance of excellent information in the report, well worth the money. There were areas which had information I haven't seen anywhere else."
"Money well spent as far as I am concerned. A clear, well-written report"
“What a great resource!”
"This data has been a huge help for us launching our dating app"


