The App Data Report offers a thorough analysis of the two key mobile operating systems—Android and iOS. Providing detailed data on consumer spending, app downloads and app store statistics. The report also includes industry benchmarks for retention, conversion and more, alongside highlights of the most installed and top grossing apps of the year.
Which mobile app store generates the most revenue?
Apple’s App Store generates more revenue than Google Play. In 2024, the App Store made $103.4 billion to Google Play’s $46.7 billion.

How many apps were downloaded in 2024?
Almost three times more apps were downloaded on the Google Play Store than the Apple App Store in 2024.
What was the most downloaded app of 2024?
TikTok was the most downloaded app in 2024, taking back the top spot from short-form video rival Instagram.

Sector overview
Apps are the lifeblood of the iOS and Android economy, responsible for over $400 billion in revenue across both ads, subscriptions and in-app purchases. Apple and Google, the two platform operators, are responsible for over 90% of app downloads.
Both apps stores were launched shortly after the release of the first version of each respective operating system. In Apple’s case, the iOS App Store launched in 2008 with 500 applications available. Apple CEO at the time Steve Jobs was originally in favour of not having any third-party apps on the device, but changed his mind after six months.
In Google’s case, a limited app store was built into the first edition of Android and expanded in later editions. Google would go on to rebrand the operating system as the Google Play Store in the mid-2010s.
There were a few smaller competitors such as Symbian, BlackBerry and Windows Mobile in the 2000s and early 2010s, but none were able to break the dominance of Android and iOS. This has provided Apple and Google with immense control over their respective systems, which has led to some developer backlash due to lack of customization options and excessive fees for in-app purchases.
Table of contents
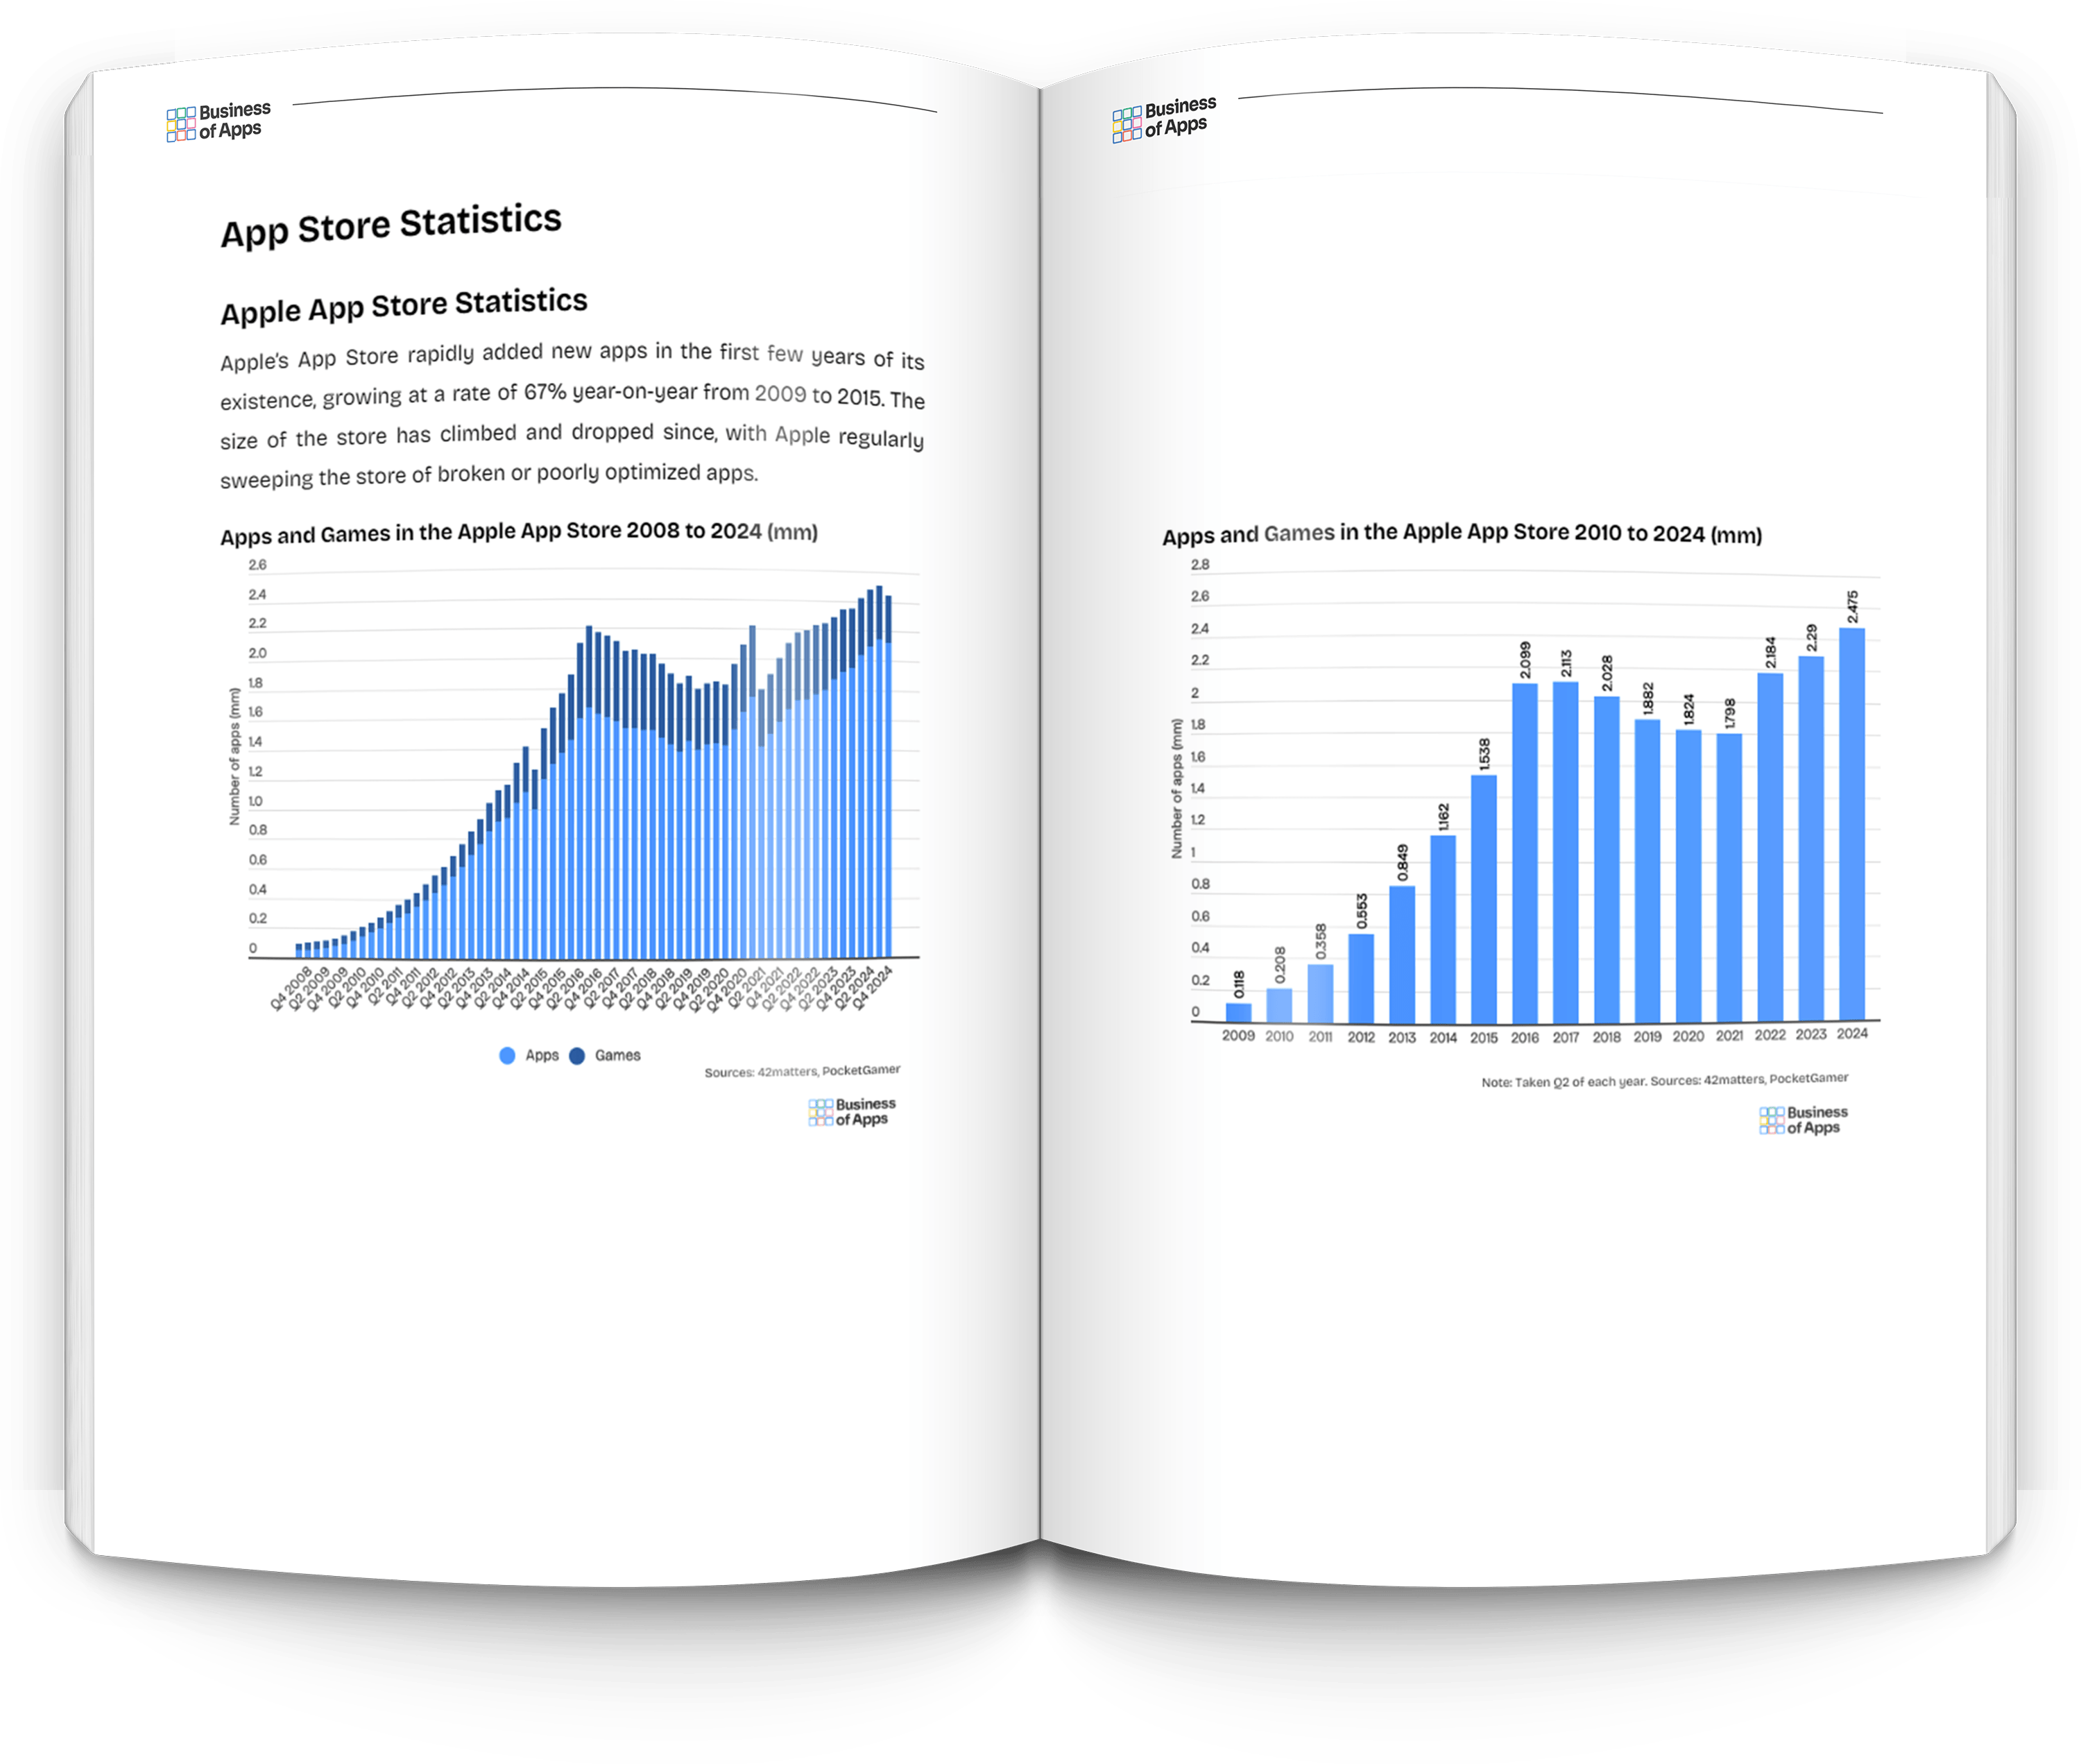
- App Store Statistics
- Number of Apps and Games
- Most Popular Categories
- Paid Apps Statistics
- In-App Purchases
- App Revenue Statistics
- Mobile Ad Spend
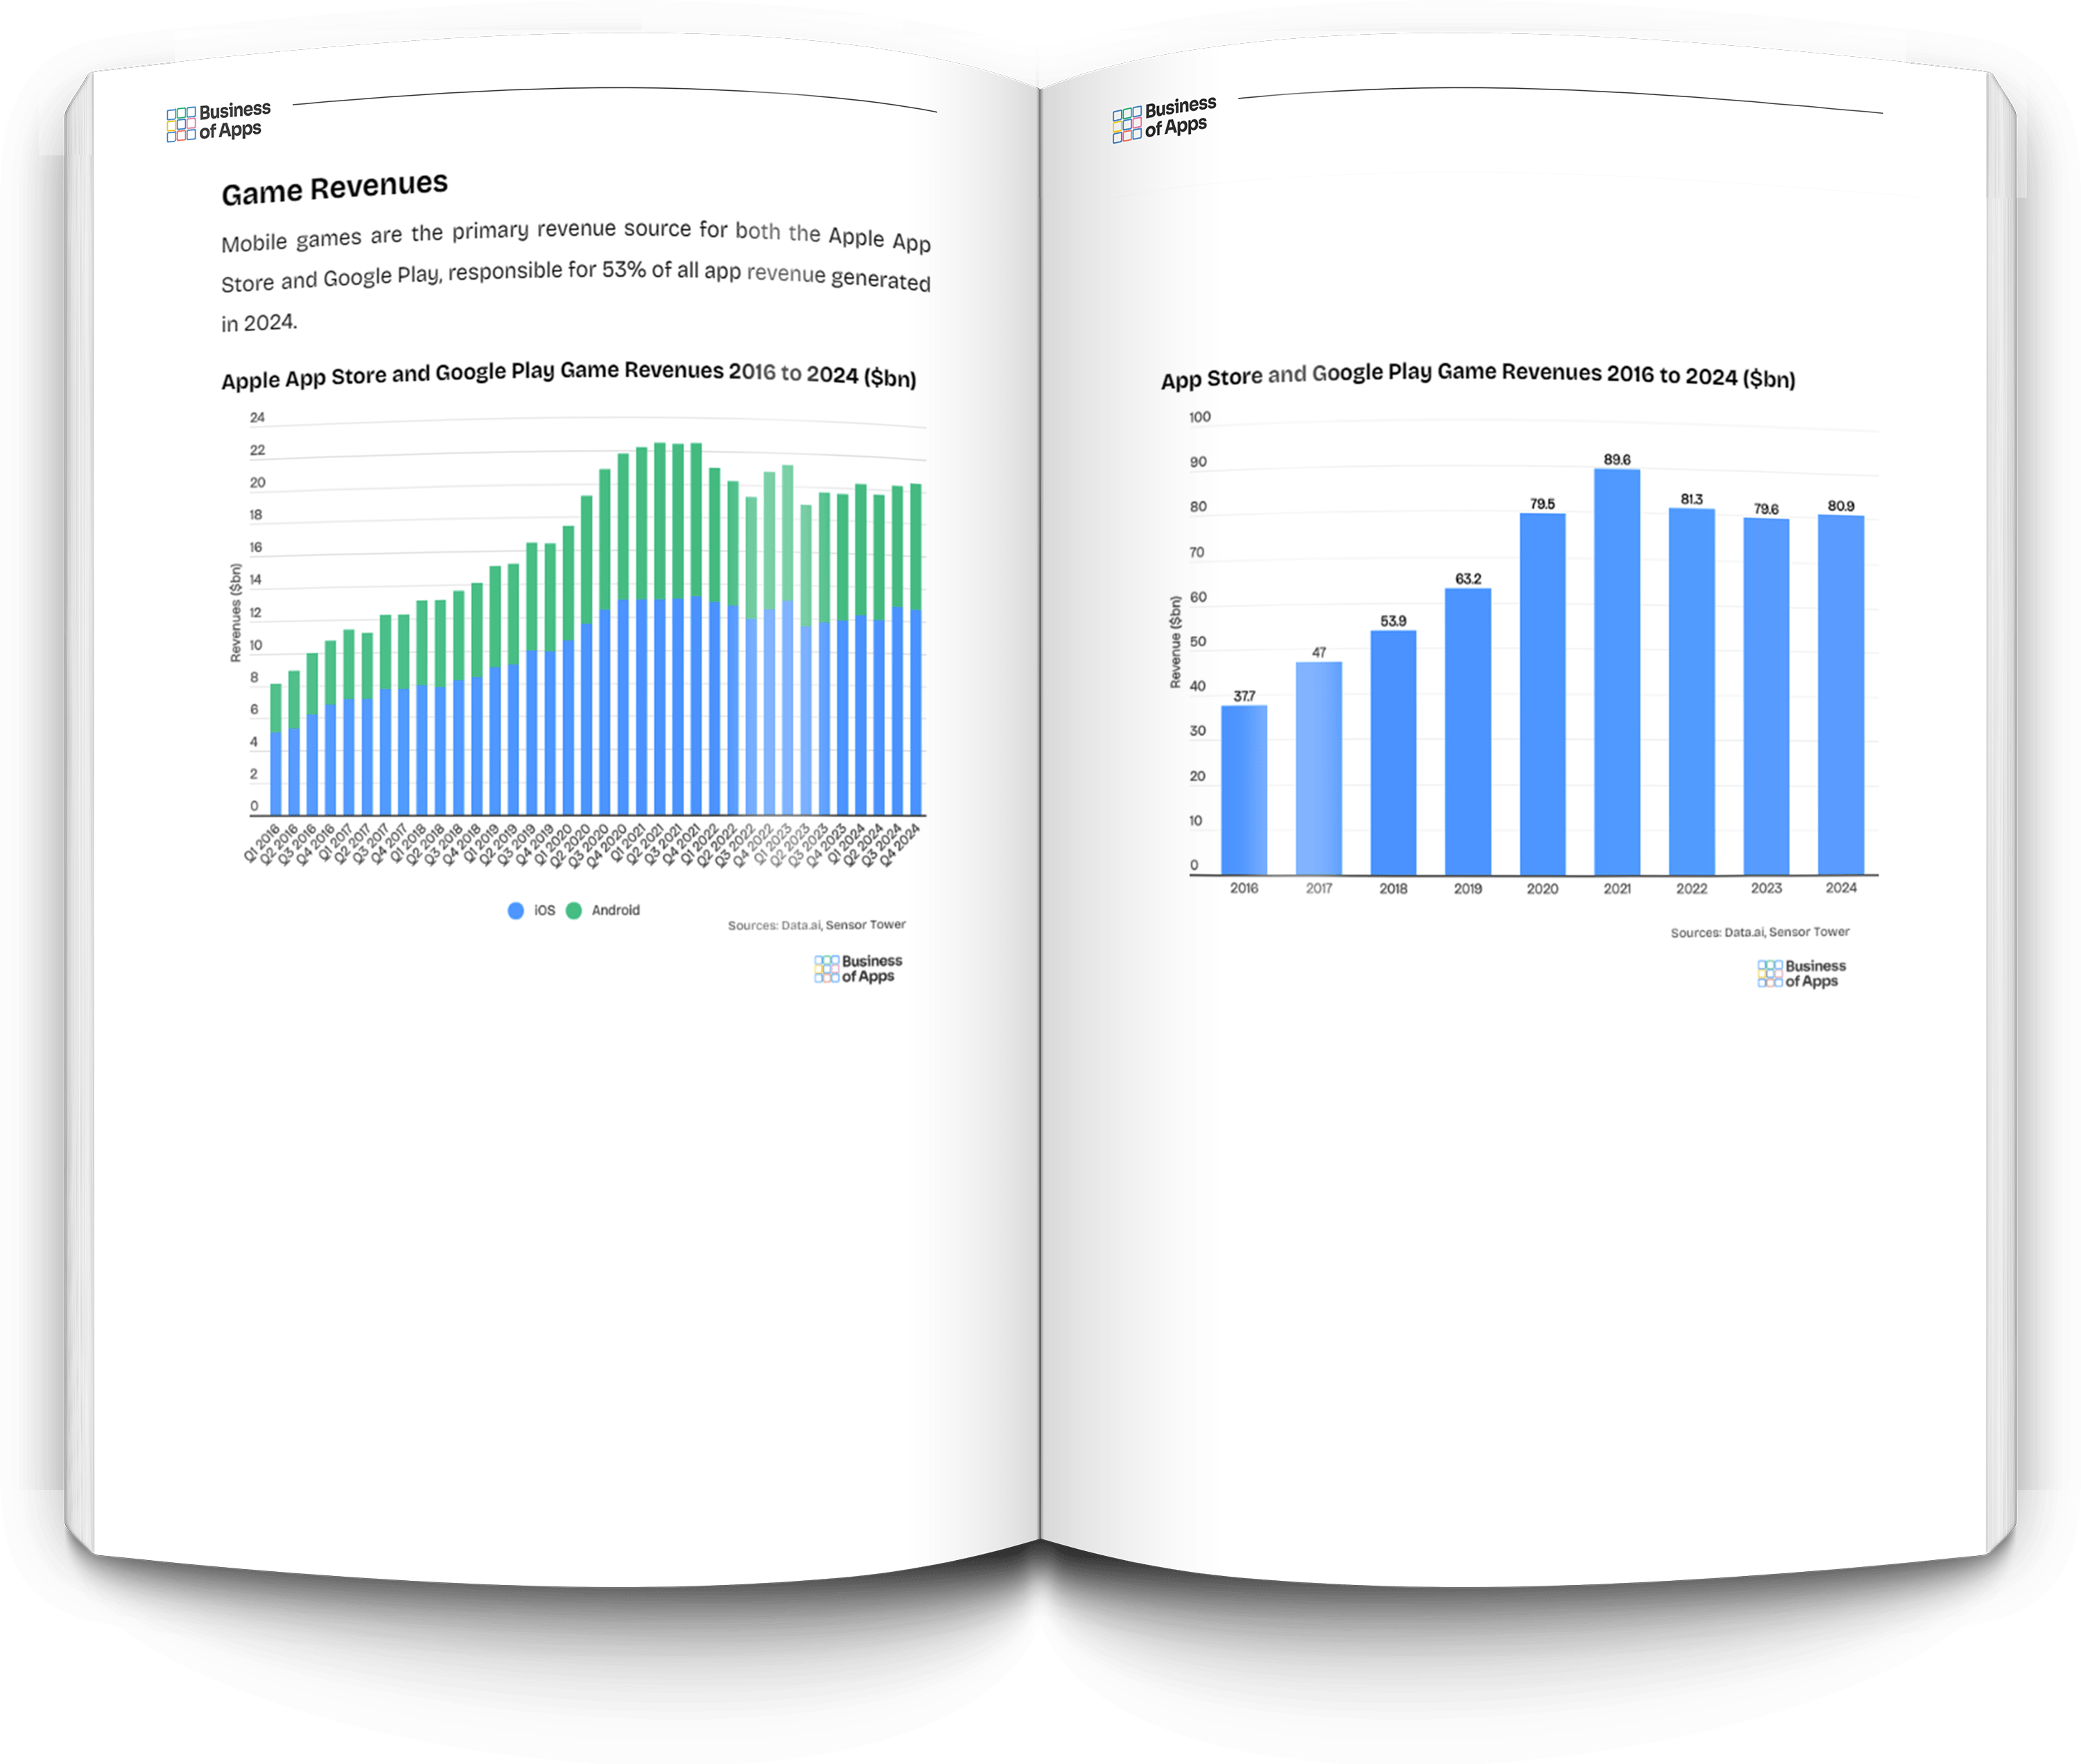
- App and Game Revenues
- Subscription Revenues
- Spend by Country
- Spend by Region
- Revenues by Genre
- App Download Statistics
- App and Game Downloads
- Downloads by Country
- Hours Spent by Country
- App Benchmarks
- App Conversion
- App Retention
- App Acquisition
- App Subscription
- App Demographics
- Top Grossing Apps
- Apps and Games
- Apps and Games by Country
- Apps and Games by Platform
- Apps and Games by Category
- Most Popular Apps
- Apps and Games
- Apps and Games by Country
- Apps and Games by Platform
- Apps and Games by Category
The App Data Report – Research, Insights and Statistics is provided as downloadable PDF document with all data presented as charts and tables. It provides an overview of the company’s financials, as well as data on demographics and user breakdowns.

What’s included?
- Document: PDF
- Charts: 186
- Data Points: 3655
- Pages: 191
Don’t waste time searching the internet for app data – get all the main analysis in this report in one package, sourced and analyzed from multiple validated sources.
List of Charts
- Apps and Games in Apple App Store
- Apps in Apple App Store
- Games in Apple App Store
- Most Popular Categories in Apple App Store
- Paid vs Free Apps in Apple App Store
- Paid App Price Distribution on Apple App Store
- Average Price of Paid Apps in Apple App Store
- Apps and Games in Google Play Store
- Apps in Google Play Store
- Games in Google Play Store
- Most Popular Categories in Google Play Store
- Paid vs Free Apps in Google Play Store
- Paid App Price Distribution on Google Play Store
- Average Price of Paid Apps in Google Play Store
- Combined Apps and Games in Both Stores
- Combined Apps in Both Stores
- Combined Games in Both Stores
- In-App Purchase Average Cost
- Paid App Price Distribution
- Mobile Ad Spend
- Apple App Store and Google Play Game and App Revenues
- App Store Revenues by App Type
- Apple App Store Game and App Revenues
- Google Play Game and App Revenues
- Apple App Store and Google Play Game Revenues
- Apple App Store Game Revenues
- Google Play Game Revenues
- Apple App Store and Google Play App Revenues
- Apple App Store App Revenues
- Google Play App Revenues
- Apple App Store and Google Play Subscription App Revenues
- Apple App Store Subscription App Revenues
- Google Play Subscription App Revenues
- Consumer App Spend by Country
- App Revenues by Region
- Game Revenues by Genre
- Apple App Store and Google Play Game and App Downloads
- Apple App Store Game and App Downloads
- Google Play Game and App Downloads
- Apple App Store and Google Play Game Downloads
- Apple App Store Game Downloads
- Google Play Game Downloads
- Apple App Store and Google Play App Downloads
- Apple App Store App Downloads
- Google Play App Downloads
- Downloads by Country
- Hours Spend by Country
- App Conversion Rates
- App Acquisition Costs
- App Retention Rates
- App Retention Rates by Category
- App Retention Rates by Country
- App Subscription Rates
- Distribution of Subscription Apps by Category
- Distribution of Ad Spend by Platform
- App Renewal Rates
- App Activation Rates by Category
- App Demographics by Category
- Top Grossing Apps & Games
- Top Grossing Apps
- Top Grossing Games
- Top Grossing in Apple App Store
- Top Grossing in Google Play Store
- Top Grossing Apps in US
- Top Grossing Apps in UK
- Top Grossing Apps in India
- Top Grossing Apps in Japan
- Top Grossing Apps in South Korea
- Top Grossing Apps in Germany
- Top Grossing Apps in France
- Top Grossing Apps in Brazil
- Top Grossing Apps in Turkey
- Top Grossing Apps in Spain
- Top Grossing Apps in Canada
- Top Grossing Apps in Australia
- Top Grossing Apps in Indonesia
- Top Grossing Entertainment Apps
- Top Grossing Music Apps
- Top Grossing Social Apps
- Top Grossing Dating Apps
- Top Grossing Health & Fitness Apps
- Top Grossing Education Apps
- Top Grossing Tools Apps
- Top Grossing Photo & Video Apps
- Top Grossing Reading Apps
- Top Grossing News Apps
- Top Grossing Casual
- Top Grossing Hypercasual
- Top Grossing Midcore
- Top Grossing Role-Playing Games
- Top Grossing Puzzle Games
- Top Grossing Shooter Games
- Top Grossing Strategy Games
- Top Grossing Adventure Games
- Top Grossing Casino Games
- Top Grossing Simulation Games
- Most Downloaded Apps
- Most Downloaded Apps on Apple App Store
- Most Downloaded Apps on Google Play Store
- Most Downloaded Apps in US
- Most Downloaded Apps in UK
- Most Used Apps in China
- Most Downloaded Apps in India
- Most Downloaded Apps in Brazil
- Most Downloaded Apps in Germany
- Most Downloaded Apps in France
- Most Downloaded Apps in Italy
- Most Downloaded Apps in Spain
- Most Downloaded Apps in Canada
- Most Downloaded Apps in Japan
- Most Downloaded Apps in South Korea
- Most Downloaded Apps in Turkey
- Most Downloaded Apps in Australia
- Most Downloaded Apps in Indonesia
- Most Downloaded Publishers
- Most Downloaded Games
- Most Downloaded Social Apps
- Most Downloaded Business Apps
- Most Downloaded Entertainment Apps
- Most Downloaded Music & Audio Apps
- Most Downloaded Shopping Apps
- Most Downloaded Food & Drink Apps
- Most Downloaded Travel Apps
- Most Downloaded Education Apps
- Most Downloaded Dating Apps
- Most Downloaded Health & Fitness Apps
- Most Downloaded Finance Apps
- Most Downloaded Hypercasual Games
- Most Downloaded Midcore Games
- Most Downloaded Arcade Games
- Most Downloaded Puzzle Games
- Most Downloaded Role-Playing Games
- Most Downloaded Simulation Games
- Most Downloaded Adventure Games
- Most Downloaded Action Games
- Most Downloaded Strategy Games
- Most Downloaded Casino Games
- Most Downloaded Racing Games
- Most Downloaded Word Games
- Most Downloaded Trivia Games
- Most Downloaded Tabletop Games
- Most Downloaded Party Games
- Most Downloaded Game Publishers
How does it work?
To get access to the App Data Report – Research, Insights and Statistics hit the buy button above. After payment you will be taken to the download page to access your App Data Report – Research, Insights and Statistics. If you need any help email data@businessofapps.com.
We have joined Treeapp, an incredible organization dedicated to reforesting the world. They will plant one tree for your data report purchase.
What our customers say about our reports

“Your report gave us some very useful insights on app statistics. As we are starting to develop apps it’s crucial information”

“This report is great work, it helped us get a better understanding of revenue and growth to include it in our analysis for LatAm. It has been very useful.”

“We have found Business of Apps data to be most accurate and complete on the web.”

“All the metrics and KPIs I was looking for are in one document for a very good price. The report was exactly what I expected.”

"There was an abundance of excellent information in the report, well worth the money. There were areas which had information I haven't seen anywhere else."

"Money well spent as far as I am concerned. A clear, well-written report"

“What a great resource!”

"This data has been a huge help for us launching our dating app"