Fraudulent traffic in online ad campaigns is a well-known and recognized issue that the majority of marketers have been facing for a long time. Due to the global situation and isolation measures that have been taken by the governments all over the world at the beginning of 2020, lots of people spent much more time online than they used to. So almost all traffic sources have witnessed an noticeable increase in volumes and user activities. And fraudsters have done their best to cease the opportunity as well.
FraudScore – the independent antifraud solution – shares their exclusive report about the global ad fraud statistics and opens up about some drastic changes in fraudsters’ activities in January-April 2020. FraudScore has specifically selected Jan-Apr 2020 for the report to demonstrate the turns that have happened with online advertising traffic and ad fraud due to global restriction and isolation measures.
Here are some crucial facts from the report:
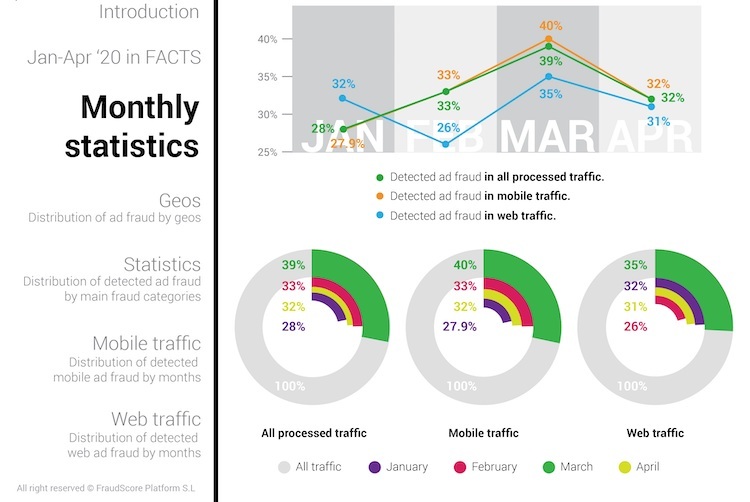
- In general, March 2020 showed a pick in detected ad fraud – both in absolute numbers and in shares – from 33% in February (28% in January) to 39% of fraud in March.
- Mobile traffic has jumped up from having 27.9% of fraud in January, to 40% in March.
- Web campaigns started February with 26%, but an increase again in March – up to 35%.
- EU geo has jumped up in numbers for detected ad fraud from January 2020 (21%) to 31% in February and whopping 40% in March.
- Russia&CIS geo is still the leader in fraudulent traffic among global geos, but the increase in % is still fascinating – 38% in February and 47% in March and April.
- APAC countries have shown 35% of fraud in February and reaches 39% in March. April statistics show a decrease down to 31%.
- In mobile OS – fraudulent traffic on Android devices has grown from 30% in January up to 46% in March and 37% in April. The most fraudulent geos were Russia&CIS, India and EU.
- The most fraud-prone Android app categories were Games, News&Magazines and Productivity.
- In iOS traffic statistics have shown a constant monthly growth starting from January with 24% of detected ad fraud to February 27%, March 28.8% and April with 31%. Russia, Middle East and EU are the most suspicious geos.
- The most fraud-prone iOS app categories were Books&News, Entertainment and Sports.
- In both OS – Games and Entertainment apps have shown a noticeable growth in detected ad fraud since 2019 – at least by 18%. There is also an increase in ad fraud in Food (restaurants) and Business apps categories on both OSs.
To learn more about ad fraud global geo map, distribution iif ad fraud types detected by FraudScore and many more interesting facts and insights and trends – download the full versions of FraudScore ad fraud report for January-April 2020.


